Personal Project, Public Outage: A Lesson in Incident Management
Recently, I experienced a minor outage on a personal VM instance hosted on Google Cloud Compute. While the stakes were low, the process of diagnosing and resolving the issue, and then ensuring it doesn’t happen again, was a learning experience that I’d like to share.
Silent outage
The incident began, as many do, with a simple observation: a new, work-in-progress application I had deployed was not responding. This application was built using Spring Boot and was deployed as a containerised service (using docker). The fact that my new application was not working was not alarming; new deployments often have teething problems - and I had consciously deployed a rough-around-the-edges application to test it on different devices.
However, my routine check on other, stable services running on the same VM (twirl.otee.dev and remind.otee.dev) revealed a more serious issue – they were down as well.
My first instinct was to SSH into the virtual machine to inspect the logs. However, to my shock, my attempts to connect, both from my local machine and through the GCP browser-based utility, timed out. This was a significant red flag; an unreachable SSH daemon indicated a fundamental problem with the VM itself.
A glance at the GCP dashboard for my instance revealed stressed CPU and disk I/O graphs from sometime earlier, confirming that the system had been under duress.
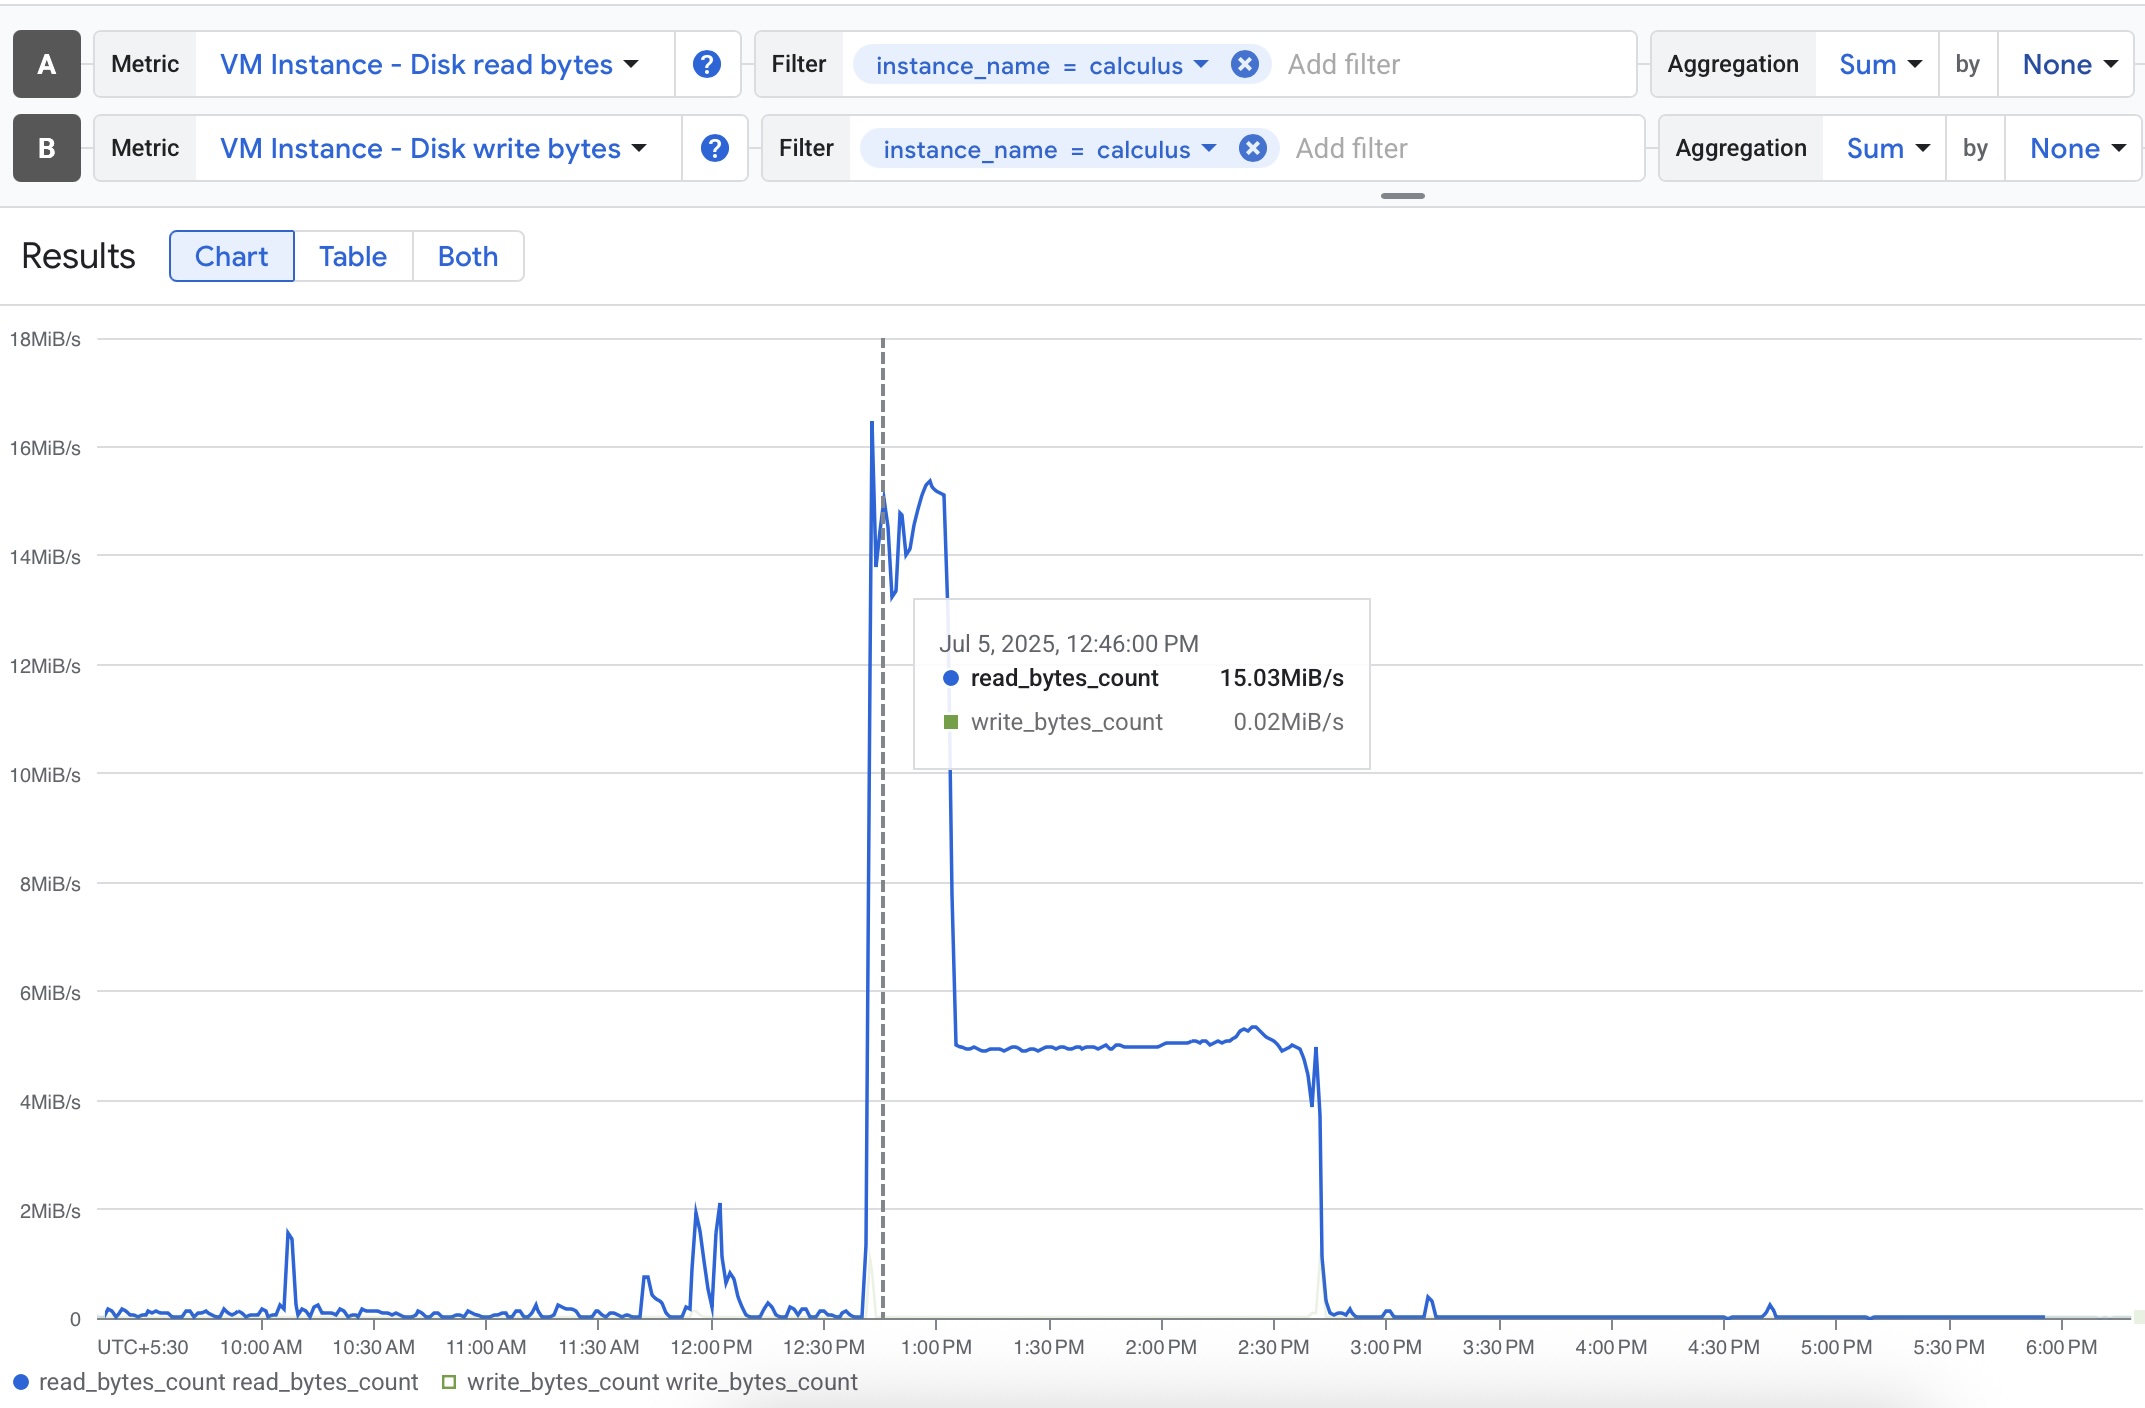
Disk operations during the outage
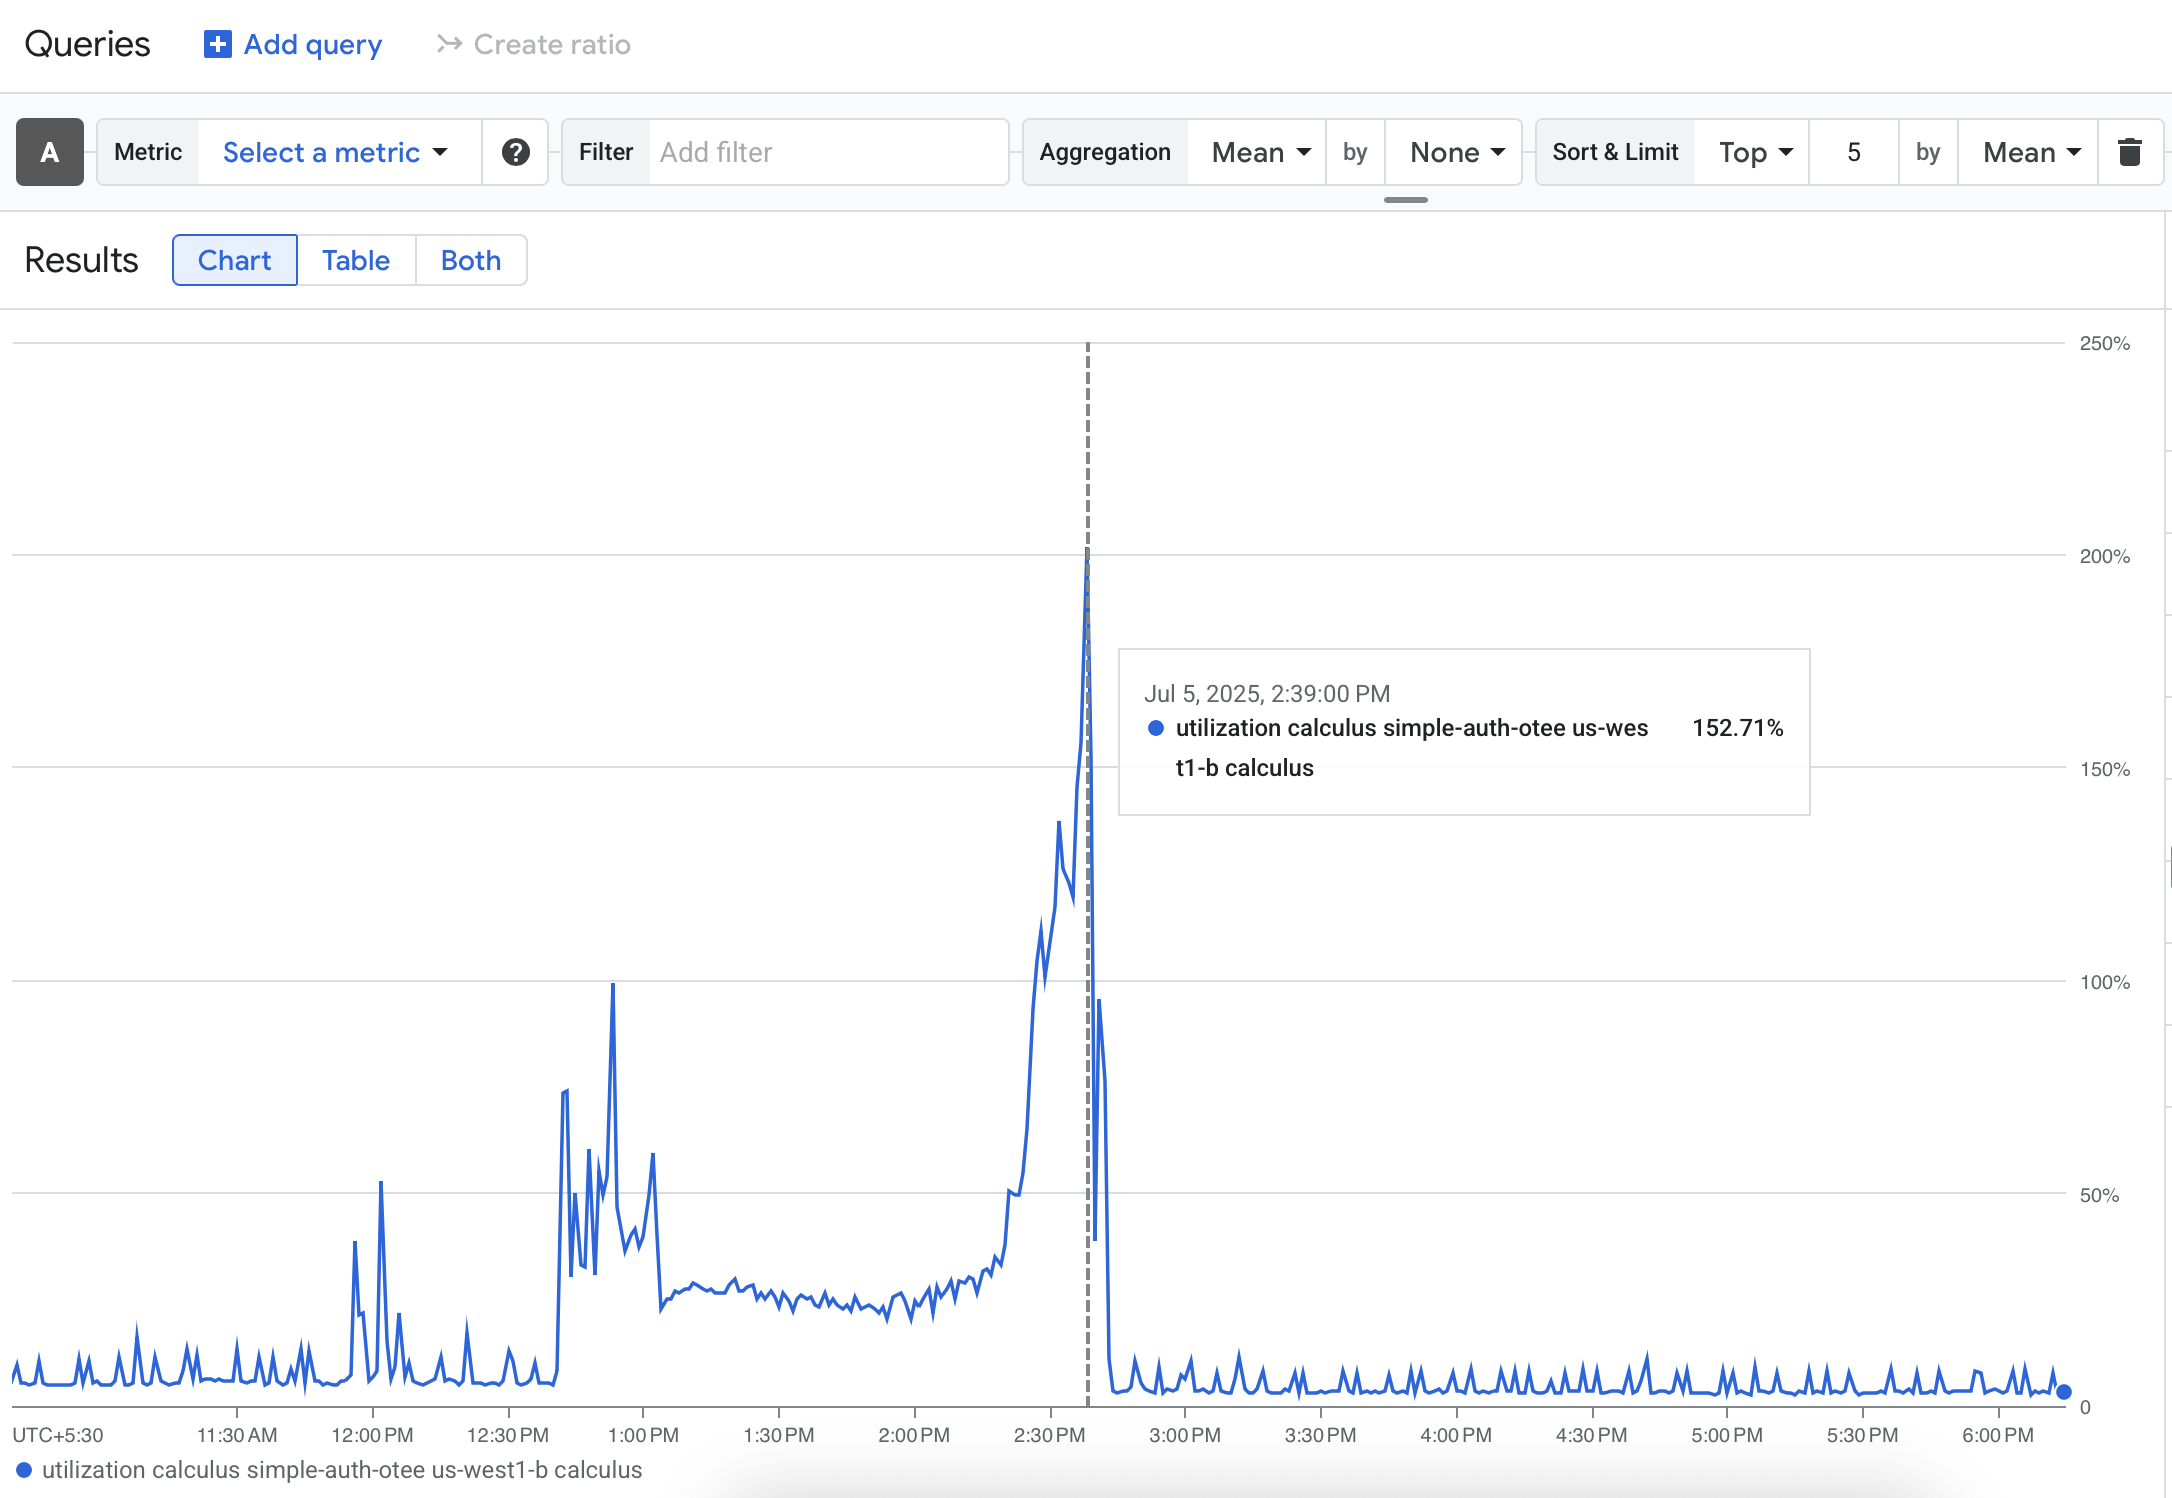
CPU utilisation during the outage
This was a classic case of a “silent failure” – an issue that could have persisted for days had I not chanced upon it. In any software engineering company, this would have been an incident, in the rest of the post, I will treat it as such in three steps: mitigation, root cause analysis, and prevention.
The Mitigation: A Step-by-Step Recovery
The primary goal was to bring the stable services back up and running. With direct access to the instance unavailable, I was constrained to take a more forceful step: a “hard” reboot. I initiated a stop and start of the VM instance directly from the GCP dashboard.
This brought one of the services, remind.otee.dev, back online. However, twirl.otee.dev was now serving a 502 Bad Gateway error, (meaning, nginx was working but the application server was not).
Thankfully, the reboot had restored SSH access. Once inside the VM, a quick check of the running services confirmed my suspicion. The twirl.service was not running. I inspected the list of enabled systemd services using:
systemctl list-unit-files --type=service --state=enabled
As it turned out, twirl.service was not on this list, meaning it wouldn’t automatically start on a system reboot. I enabled it with:
sudo systemctl enable twirl.service
And then started it manually:
sudo systemctl start twirl.service
A final check of the service’s logs showed no errors, and twirl.otee.dev was back online.
sudo journalctl -u twirl.service -f
Finding the root cause
With the immediate fires extinguished, my focus shifted to understanding the root cause of the initial outage. The swipe service, my new work-in-progress application, was the prime suspect.
An analysis of the serial port logs from the GCP dashboard provided the smoking gun:
Jul 5 09:08:13 calculus kernel: [94239163.698111] Out of memory: Killed process 4494 (java) total-vm:1870112kB, anon-rss:170216kB, file-rss:0kB, shmem-rss:0kB, UID:0 pgtables:604kB oom_score_adj:0
This meant that a Java process had become so memory-intensive that the Linux kernel’s “OOM Killer” had to step in and kill it.
Subsequent logs pointed to issues with Docker:
Jul 5 09:09:22 calculus containerd[4191566]: time="2025-07-05T09:09:12.618001383Z" level=error msg="failed to delete" cmd="/usr/bin/containerd-shim-runc-v2 -namespace -address /run/containerd/containerd.sock -publish-binary /usr/bin/containerd -id b382fb9a6e7a6fd4e5f6c1a44faaa35ae6a627cc85af49f928c209398bfd17ba -bundle /run/containerd/io.containerd.runtime.v2.task/*/b382fb9a6e7a6fd4e5f6c1a44faaa35ae6a627cc85af49f928c209398bfd17ba delete" error="signal: killed"
The swipe service was the only Java process and the only containerized service running on the instance. It was clear that my new application was using more memory than what the VM could provide, causing the OOM Killer to step in.
Upon checking the Dockerfile it emerged that there were no resource limits specified (like the -Xmx flag for heap size). The JVM, by default, can be greedy with memory, consuming more memory than the instance could afford.
FROM eclipse-temurin:24-jdk-alpine
COPY target/swipe-0.0.1-SNAPSHOT.jar swipe.jar
EXPOSE 3001
ENTRYPOINT ["java","-jar","swipe.jar","--server.port=3001"]
Prevention of future outages
To prevent a similar silent outage from happening again, I implemented the following:
- Proactive Alerting: The first and most obvious fix. I have now configured alerts in Google Cloud Monitoring to send me an email if CPU utilization or memory usage exceeds 80% for more than five minutes. A silent failure should never be silent again.
- JVM memory limits: Limiting the max heap size available to
swipeto 128MB, while starting the application viaDockerfile:
# Set max heap size to 128MB
ENTRYPOINT ["java","-Xmx128m","-jar","swipe.jar","--server.port=3001"]
- Enforce Container Resource Limits: In addition to limiting memory usage at the application-level, updating the
docker-compose.ymlfile to limit the total memory available to the containers:
services:
  app:
    # ... other configs
    mem_limit: 256m
    mem_reservation: 128m
  postgres:
    # ... other configs
    mem_limit: 256m
- Add memory limits on docker process: Additionally, limiting the total memory that the docker process can access, by adding
MemoryLimitandMemoryAccountinginswipe.servicein systemd:
[Service]
...
MemoryAccounting=true
MemoryLimit=512M
Takeaway: A lesson in devops
This incident was a stark reminder that our work doesn’t end with writing code. The infrastructure that supports our applications is equally critical.
It brought to light the importance of solid software engineering fundamentals, like resource management and proactive monitoring.
But perhaps the most important lesson was in the incident response itself. In the heat of the moment, the priority should always be to restore service first - diagnosing the root case can be done after services are restored.